A little less than a year ago, I wrote a post about remote debugging tools. Since that time the landscape has changed, so this post will try update where we are in the world of remote debugging. (Note: by ‘we’, I mean me, and by ‘world’ I really mean, what I’ve used since last year)
First, lets review where we were a year ago. Chrome for Android was brand new, and had remote debugging support baked in. Opera Dragonfly had great remote debugging support. Adobe Shadow (now Edge Inspect) was new, and WEINRE was still a .jar.
Fast forward to now. Chrome for Android still has great remote debugging support, when connected you can see all your inspectable tabs from your remote device, and debug away. In Opera land, things have shifted a bit. Since they have started their switch to Webkit, who knows where their remote debugger will be in another year. Adobe Edge Inspect is a very popular debugging toolset for iOS and Android. Weinre is now (debatably) more accessible as a Node.js server, making it super easy to install and run a local/or remote hosted server. Weinre powers the phonegap debug service . It is also the service behind the experimental mobile debugging option at jsfiddle.net.
The newest version of jsbin.com has a pretty incredible remote rendering capability, but you can see for yourself on youtube:
Over the course of the last year, Firefox has built a homegrown set of Developer tools, so developers need not rely soley on Firebug on Firefox. These tools have been built with remote debugging as a high priority - with the proliferation of Firefox on Android, and the fancy new Firefox OS - remote debugging is important. Remote debugging for Firefox has been around for a few versions, but I really like to live on the nightly branch (currently 22.0a1), so thats what you’ll see here. Its quite simple to enable on your computer: just swing over to ‘about:config’ and toggle ‘devtools.debugger.remote-enabled’ to ‘true’ restart, and you are set.
\
Next (assuming you’ve got your android platform-tools installed) you simply connect your device to your computer and
adb forward tcp:6000 tcp:6000
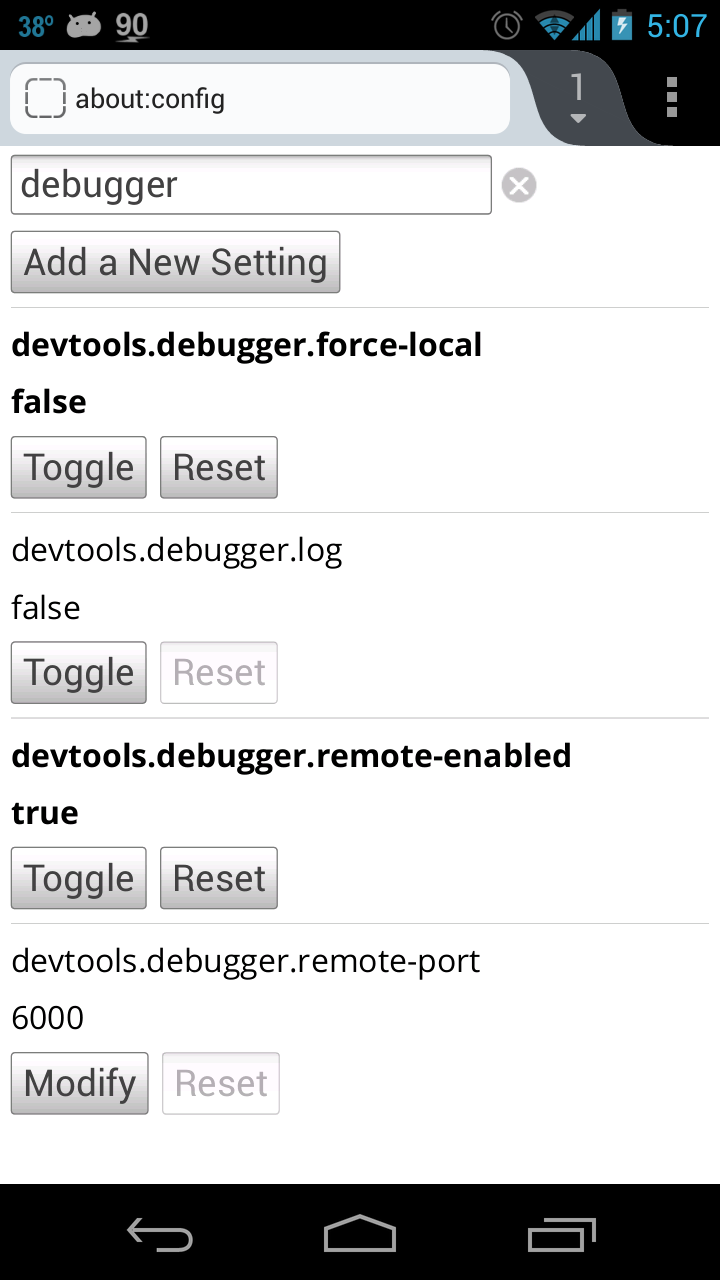
Then, assuming you have enabled remote debugging on your Android device, you again go to ‘about:config’ and toggle the ‘devtools.debugger.force-local’ to ‘false’ and ‘devtools.debugger.remote-enabled’ to ‘true’.
Restart. Debug. To Debug you open the remote console by selecting ‘Connect…’ from the Tools > Web Developer menu. Thats it.
Remote debugging is important. And as the web development industry moves more toward mobile, these tools need to and will get better and more accessible for everyone. I expect I’ll be revisiting this topic again soon as tools improve or emerge.